Arduino data logger - Current measurement
The turbine I have been making are quite small and so produce limited power.
A 10 Amp digital multimeter has been use until now so this would be the upper limit of the range I would need.
With an Arduino ADC resolution of 0 to 1023 it would give me a steps of approximately 10mA.
There seemed to be two possible methods to convert the current into a 0-5V range for the Arduino ADC.
- Measuring the voltage drop across a shunt resistor in series with the wiring to the battery.
I was keen to minimise the resistance in the circuit so the shunt resistor would need to be small.
This would mean the voltage difference would need to be amplified to make full range of the Arduino ADC.
I also wanted to isolate the Arduino from the charging circuit as much as possible and this would require
a direct connection.
- A Hall effect current measurement sensor.
This would have the additional benefit of completely isolating the turbine charging circuit from the Arduino.
There seemed to be a number of options available, but once the surface mounted components were discarded
(too small for my soldering ability) the products where intended for larger currents.
In the end I choose to try a Hall effect sensor with a rail-to-rail op amp to increase the signal
to 5V. The rail to rail op amp has a constant gain across nearly the full 0-5V range allowing the
maximum resolution on the ADC. The main components used are:
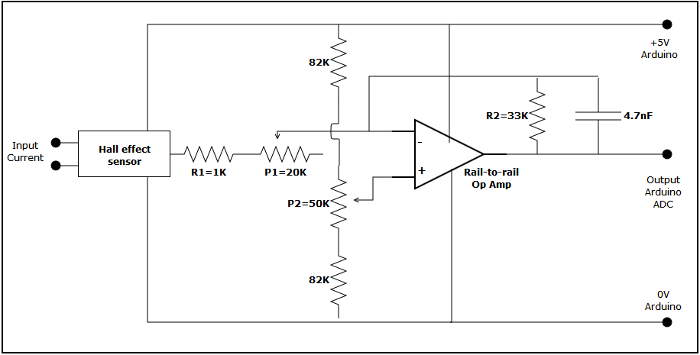
The full circuit diagram is:
- The trimmer resistance (P1) allows adjustment of the gain of the amplifier. The gain is determined by R2/(R1 + P1)
which in this case gives a range of 33 to 1.5 depending on the value of P1.
- The trimmer potentiometer (p2) on the voltage divider allows the zero current position to be adjusted.
Calibration
In practice it is quite simple to start collection from the ADC, adjust the gain to a suitable range by
putting a DC test current through the sensor, and then adjust the potentiometer with no current flowing so the ADC readings
are near the top of the range (e.g. ~1000).
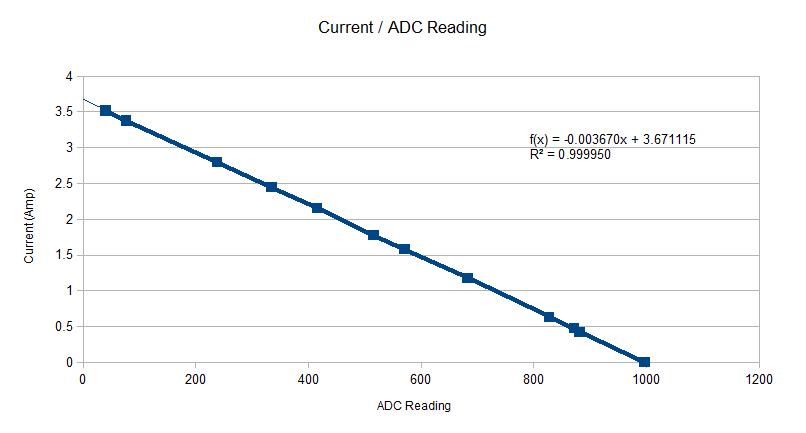
To check the linearity of the output I put various currents through the sensor and plotted the associated ADC
readings at maximum gain. Calibration can either be done by taking a number of readings, entering them into a
spread sheet and using the equation of the trend line or just calculating the equation of a line through two
known currents at either ends of the scale.

- One thing that caught me out initially was to forget that the current is not smooth but rectified AC
(single phase in this case). The peak current will be √2 = 1.4 times the average current so the range in the
case above would be limited to 3.6/√2 = 2.5A. I would expect a 3 phase alternator to have a much smoother
output.
- The ADC reading seemed to drift over time and use. This was only a small amount and more obvious if the gain was high.
I tried putting a reverse current through the hall effect sensor and this brought the zero point back towards it's
original position. It was an annoyance more than a serious inaccuracy as the logger would indicate a small current
and power instead of zero. I tried adjusting the potentiometer P2 to zero the output but this is far too coarse to
adjust accurately. In the end I changed the software calibration periodically to reset the zero position.
-
The current being measured is rectified AC, not smooth DC. The Arduino software needs to sample the voltage a number of times over each cycle to correctly calculate the average.
| 

