DIY wind turbine (2)
Alternator Testing
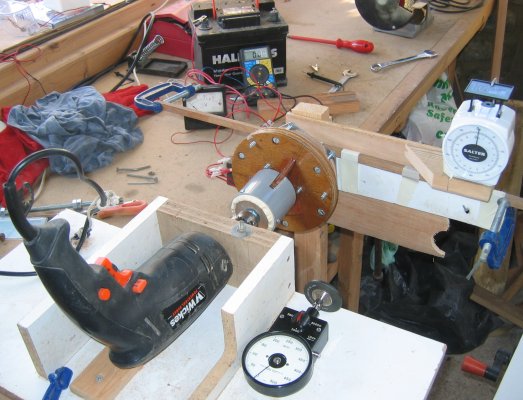
With the first alternator I had only measured the output power, but with this one I wanted to get an idea of how much power was required as input so I could attempt to match it to the blades. This resulted in the test setup in the picture above.
The hub and alternator were assembled but where the axle would normally be held static in the turbine body it was allowed to rotate in two more bearings embedded in the wooden housing. The white plastic lever in the photo is attached at one end to the stator bolts that normally engage with the turbine body and at the other end attached to the scales by a wire. This allows the torque on the axle and stator to be measured off the scales as the length of the lever arm is known. The two G-clamps on the ends of the lever are simply there to provide a damping mass to stop the dial on the scales vibrating too much. The tachometer in the foreground was held against the rim of the hub to give a reading of the RPM when corrected for the difference in diameter. The volt and amp meter in the background give the output power and the battery was used as a load. The variable speed drill provides the input power.
The results of the no load voltage and power input and output with the stator windings connected in series are shown below.


The first thing to notice is how the efficiency of the alternator drops as the power increases. 40 watt output requires something like 140 watt input or about 30% efficient. There are very low friction losses as the input torque is negligible when running with no load. To check this I calculated the theoretical input power based on the current and resistance. This is made up of the sum of three parts.
When these losses are calculated and plotted on the power graph it produces the pale blue line. The way to make the alternator more efficient would be to reduce the resistance in the stator windings which in turn would require shorter and thicker wires and probably more or larger magnets.
The other interesting thing is the cut in speed of the alternator. The car battery used as load requires approximately 12 volt from the alternator before charging can start. This equates to approximately 400 rpm on the voltage graph. In practice charging starts at about 300 rpm when the voltage should be about 9 volts. I'm assuming that this happens because the voltage from the alternator is not smooth DC but rectified AC. The volt meter is averaging the voltage while the peaks of the DC are actually over 12 volts allowing some current to flow.
| ||
Links
| ||
I do not warrant the correctness of this content. The risk from using it lies entirely with the user. While using this site, you agree to have read and accepted the terms of use.
Copyright © 2026. All Rights Reserved. Privacy policy